In the era of Agentic AI, enterprises increasingly demand full transparency into how autonomous systems reason, decide, and execute workflows. With AI-driven agents spanning Manufacturing & Industrial, Robotics, observability isn’t just a nice-to-have—it’s essential for performance, compliance, and trust. That’s where OpenTelemetry comes into play. As an open, vendor-agnostic standard for collecting metrics, logs, and traces, OpenTelemetry enables enterprises to transform AI Agents from opaque “black box” entities into debuggable, auditable systems.
At Nexastack — The Agentic Infrastructure Platform — we bring this observability paradigm to life across Private Cloud AI, Sovereign AI, and AI-agent workloads. Our platform powers secure inference, contextual memory, and agent-to-agent (“A2A”) orchestration across cloud, on-prem, and edge environments. By embedding observability from the ground up, Nexastack equips CTOs, CIOs, researchers, and developers with the tools to monitor not just infrastructure but the reasoning flows of their AI agents.
In this article, we’ll explore how to architect observability for agentic workloads, define instrumentation strategy, adopt semantic conventions, and deploy patterns that make your AI agent ecosystem scalable, governable, and enterprise-ready.
Why visibility is the new currency of AI-driven systems
As organizations deploy systems built on LangChain, AutoGen, the ReAct framework, and other autonomous agents that coordinate, reason, and take action, the old rules of simply monitoring CPU, memory, or basic response time no longer suffice. In the AI era, observability becomes the ability to answer questions like:
-
What decision path did the agent follow?
-
How many tokens were consumed?
-
Which tool did the agent call, and why?
-
Did the model hallucinate or follow guardrails?
This kind of visibility is rapidly becoming the new currency for trust, compliance, performance, and cost-effectiveness. As one analyst puts it, “observability now equals watching AI” because model accuracy, data integrity, and real-time agent behaviour are now core to operational health.
In practical terms, you might track:
-
Token usage per request or per task
-
Agent decision time and tool invocation latency
-
Error/hallucination rates for LLM agents
-
Inter-agent communication flows in a multi‐agent system
Those metrics become as crucial as uptime or latency in classical apps. And because AI workflows are non-deterministic, being able to trace and inspect “why the system did X” becomes critical.
The role of autonomous agents in complex environments
Autonomous agents driven by LLMs are increasingly deployed to handle complex tasks: query retrieval, workflow orchestration, tool invocation, and state management. They operate in multi-step, multi-tool, multi-component environments. For example:
-
An LLM prompts a retrieval engine → calls a semantic search tool → processes the result → invokes an API → writes output.
-
Two or more agents collaborate, passing results, deciding on roles, and communicating with each other.
In such environments:
-
Decision paths matter: which agent, which tool, which pathway.
-
State and memory matter: what context was carried forward?
-
Non-determinism matters: the same input yields different paths and outcomes
Therefore, observability must support tracing across agents and tools, logs of tool calls, and metrics of performance and correctness. The notion of “visibility” in this era is not just about “is the service up?” but “did the agent behave as intended, did it call the right tools, did it respond in an acceptable time/accuracy?”
OpenTelemetry as the Foundation of AI Observability
OpenTelemetry emerged as a unified open-source framework that standardizes how telemetry data (logs, metrics, traces) is collected, correlated, and exported. For AI-driven systems, it provides four key advantages:
-
Vendor-neutral instrumentation: You can instrument once and export to many backends.
-
Unified data model: Logs, metrics, and traces follow standard semantic conventions and context propagation.
-
Context propagation: Especially critical in multi-component AI workflows, where you want to trace across boundaries (e.g., LLM → tool → API).
-
Scalability for dynamic systems: AI systems often spin up many ephemeral components (agents, tasks); OTel is designed for distributed/cloudnative.
Due to these strengths, OpenTelemetry is now widely adopted as the backbone of modern observability frameworks, making it the natural foundation for AI observability.
From Monitoring to True Observability
Monitoring is reactive; observability is investigative. With observability, you have the context, trace data, and logs to explore a system’s behavior—not just detect when it’s down, but understand why.
It helps to clarify terms:
-
Monitoring typically means tracking known metrics and alerts — e.g., “CPU > 80%”, “error rate > 5%”, “response time > 500ms”.
-
Observability, by contrast, is the ability to ask unknown unknowns questions: “Why did the agent’s throughput drop?”, “Which tool call caused this silent failure?”, “What decision path led to the anaphylactic response from the agent?”
Why traditional monitoring fails for AI and LLM-based agents
Traditional monitoring starts to break down when applied to AI/agentic systems because:
-
The behavior is non-deterministic: the same input yields a different outcome depending on the context or model state.
-
Many internal decision steps occur within the model or agent logic and are opaque unless instrumented.
-
There are many more dimensions to track: token usage, model version, prompt template, tool invocation count, inter-agent communication, and memory state across calls.
-
The execution spans across systems (LLM, retrieval, tool, orchestration), and traditional monitoring (e.g., service latency) doesn’t capture the chain of reasoning.
-
The root cause often lies in the sequence of decisions, not just in a metric threshold being passed. Observability requires complete trace data.
In short, you can watch “is the service responding,” but you can’t infer “did my agent make the correct decision, follow its guardrail, and call the right tool” unless you instrument deeply and correlate across metrics, logs, and traces. That is why true observability is required.

Integrating OpenTelemetry with AI Agents
When you embed OpenTelemetry (OTel) instrumentation in your agentic workflows, you unlock deep visibility into how decisions are made across tools, models, and agents.
For example:
-
A trace span begins when an agent receives a prompt.
-
Within that span, you can create sub-spans for each tool invocation, reasoning step, or inter-agent message.
-
With proper context propagation, you can ask questions like:
This traceability enables you to visualize decision paths, identify bottlenecks, and correlate agent behavior with model or prompt configurations.
Platforms such as NexaStack extend this capability by offering built-in observability and evaluation dashboards—allowing teams to trace, monitor, and analyze agent workflows seamlessly.
Using Metrics to Assess Reliability and Performance
In parallel with tracing, collecting metrics provides the quantitative foundation for understanding performance and reliability in agentic systems. Typical metrics include:
-
Request rate (tasks or agents invoked per second)
-
Token usage per request or per tool invocation
-
Model latency (time to generate inference)
-
Tool invocation count per task
-
Error or hallucination rate (for output quality)
-
Resource consumption (GPU/CPU utilization, memory.
Platforms like NexaStack enable these metrics to be visualized alongside traces, helping you detect degradation trends, manage SLAs, and benchmark agent performance over time.
Leveraging Logs for Transparency and Debugging
Logs complete the observability triad by providing narrative context. They record events such as tool calls, reasoning checkpoints, guardrail decisions, memory updates, and external API responses.
When correlated with OTel traces and metrics, logs answer key diagnostic questions:
-
Which prompt template led to a failed tool invocation?
-
At what step did the agent deviate from expected behavior?
-
Did a memory state carry over incorrectly to the next call?
Logs provide human-readable details; traces show the execution flow; metrics highlight quantitative anomalies. Combined—especially on observability platforms such as NexaStack—they deliver complete transparency into agentic performance and decision-making.
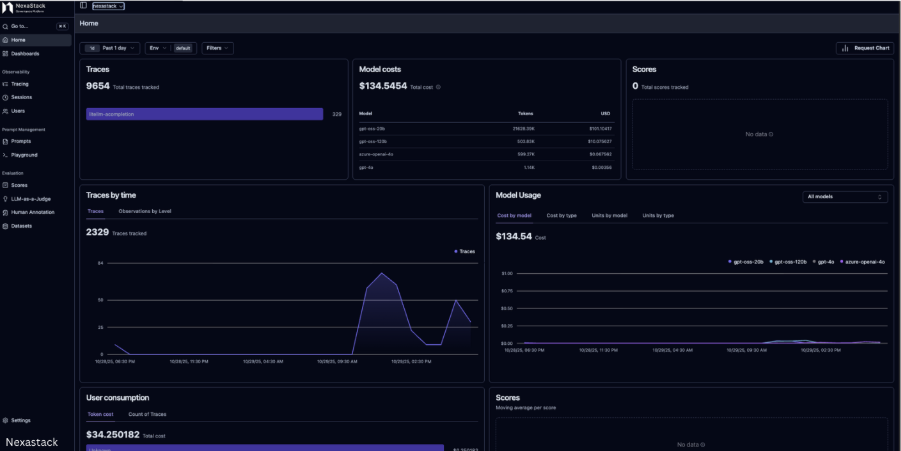
Unified Observability and Evaluation Dashboard
A comprehensive observability setup (for instance, on NexaStack) might combine:
-
Metrics for agent goal accuracy, tool-call success, and latency
-
Traces showing reasoning paths and decision branches
-
Logs providing contextual insight into failures or anomalies
Together, these elements enable the continuous evaluation and optimization of AI agents, helping teams build trustworthy, explainable, and high-performing autonomous systems. 
Fig 2: A dashboard mock-up combining metrics and showcasing performance of the agent upon AI analyses in terms of intent, agent goal accuracy, tool call accuracy, etc.
Core Telemetry Elements: Traces, Metrics & Logs
AI observability begins with three core telemetry pillars — traces, metrics, and logs. Each reveals a different layer of system intelligence:
-
Traces capture decision paths and tool calls of LLM agents.
-
Metrics quantify performance — token usage, latency, and success rates.
-
Logs explain the “why”: what decision was made and under what conditions.
Building scalable pipelines for these elements requires OpenTelemetry collectors that receive data from distributed AI components and export it to tools like Grafana, Prometheus, or Datadog.
These pipelines must handle high-frequency telemetry from reasoning agents, vector databases, and APIs while maintaining low latency and cost efficiency.
Correlating and enriching data across AI components
A single agent interaction can produce hundreds of signals — tool invocations, memory updates, model outputs. Correlation turns this raw stream into context.
-
Trace context propagation links all events in a reasoning chain — user → agent → tool → API → result.
-
Metric enrichment tags each event with metadata (agent ID, model version, token count).
-
Unified dashboards merge these layers to show what happened and why.
This correlation enables data-driven AI insights — identifying slow-performing agents, drift in reasoning behavior, or escalating token usage before costs spike.
Designing Observability Pipelines for Autonomous Systems
The OpenTelemetry SDKs for Python and JS now integrate seamlessly with popular agent frameworks:
-
LangChain: Instrument every chain step, tool call, and retriever using spans.
-
AutoGen: Trace collaborative interactions between agents to visualize reasoning flow.
-
ReAct framework: Combine reasoning and acting steps as trace hierarchies for deep behavioral insights.
Each telemetry event carries contextual tags — model version, agent type, and latency — enabling unified analysis across the stack.
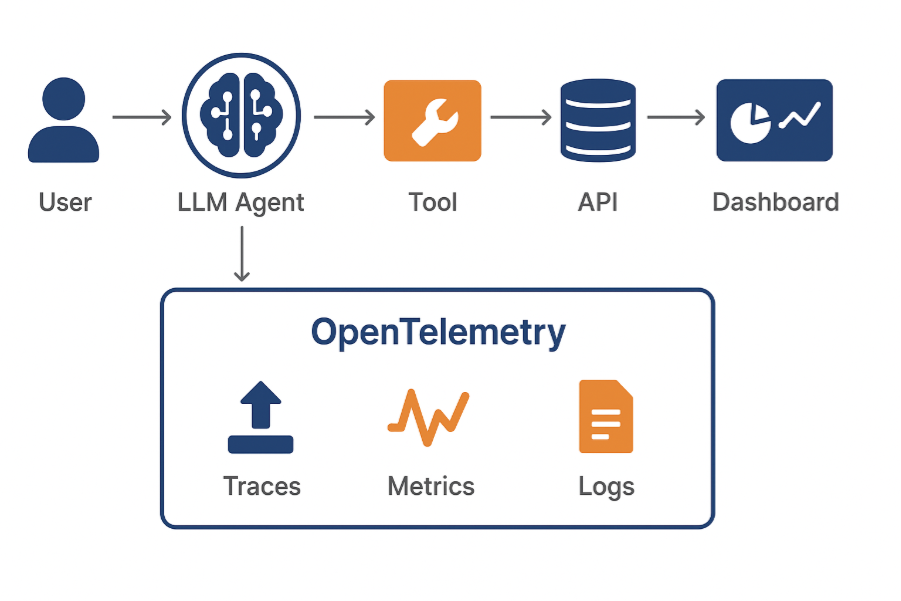
Fig 3: Illustrates a distributed AI observability pipeline where OpenTelemetry collects and exports correlated telemetry from all components for real-time analysis.
Making AI behavior measurable and explainable
Observability isn’t just technical; it’s ethical. Measurable AI behavior means knowing:
-
Why did an agent choose a path
-
Which tools influenced the decision
-
How latency or drift affected the outcome
By correlating traces with decisions, teams can generate explainable AI dashboards that satisfy compliance audits and internal transparency standards.

Use Case: Observability in Agentic AI Workflows
Consider a support automation system using LangChain and AutoGen:
-
User request enters the orchestrator.
-
Agent A interprets the query and calls the retrieval tool.
-
Agent B formats results and validates outputs.
Each action emits telemetry: a span for decision steps, metrics for latency, and logs for tool usage. By visualizing these traces, teams can quickly locate bottlenecks—such as vector DB lag or excessive reasoning hops—and optimize accordingly.
Tracing interactions in multi-agent collaboration
In multi-agent workflows, tracing shows how agents coordinate:
-
Agent A delegates retrieval to Agent B.
-
Agent B calls an analytics API.
-
Agent C synthesizes a final response.
End-to-end traces reveal inter-agent latency, data-handoff patterns, and emerging inefficiencies—making multi-agent system monitoring possible in real time.
Detecting performance drift and anomalies
Continuous observability detects subtle degradation that traditional monitoring misses:
-
Increased tool call counts per task
-
Longer reasoning paths over time
-
Drift in model accuracy or prompt adherence
Using AI performance metrics and distributed AI tracing, anomalies are flagged early, enabling self-healing AI systems that adjust before failure.

Best Practices for Real-Time AI Insights
To ensure robust telemetry for autonomous systems:
-
Instrument all agents and tools from the start—don’t retrofit later.
-
Capture traces, metrics, and logs in a single OTel pipeline for a uniform schema.
-
Tag events with business context (customer tier, job type, region).
-
Manage retention with innovative sampling and aggregation.
These practices strike a balance between visibility, performance, and cost.
Turning raw telemetry into actionable intelligence
Telemetry becomes valuable only when converted into insights:
-
Combine metrics and traces to correlate latency spikes with reasoning bottlenecks.
-
Apply anomaly detection to spot behavioral drift.
-
Feed telemetry findings back into model optimization and prompt tuning.
This closes the loop between AI system monitoring and continuous improvement.
Building transparent, trust-driven observability dashboards
Modern observability dashboards—built with Grafana or Datadog—should visualize not only performance but also behavior.
Include:
-
Decision-path visualizations from traces
-
Guardrail or policy-violation counts
-
Tool-usage trends over time.
Discovering how to maintain control over telemetry in today’s autonomous, AI-driven landscapes means embracing AI observability, including traces, metrics, logs, and agentic workflows that span multiple systems. This blog explores how to reinvent compliance and governance for AI systems, unpacks the core telemetry elements, designs observability pipelines tailored for agentic frameworks like LangChain, AutoGen, and the ReAct framework, and delivers real-time AI insights that foster trust, performance, and transparency.
Frequently Asked Questions (FAQs)
Understand how OpenTelemetry enhances visibility, reliability, and governance for AI agents across enterprise environments.
Why use OpenTelemetry for AI agents?
It standardizes tracing of agent actions, tool calls, and workflows for full observability across distributed systems.
How does OpenTelemetry improve agent reliability?
Unified traces help detect failures, slow steps, and drift in real time, enabling quicker diagnosis and correction.
Can OpenTelemetry capture agent reasoning steps?
Yes—reasoning traces and decision logs can be embedded as spans, creating a visible chain of agent actions.
How does it support multi-agent systems?
Distributed tracing links inter-agent communication, highlighting coordination issues and bottlenecks in A2A orchestration.
Does OpenTelemetry work in private or air-gapped AI environments?
Yes—telemetry can be fully local, exported to on-prem collectors without sending data to external services.